|
|
EXPERIMENTAL RESULTS AND DARK MATTER WAVES
Orvin E. Wagner
Wagner Research Laboratory
Grants Pass, OR 97527
Email: oedphd@gmail.com
ABSTRACT: I present results from years of experiments dealing with waves that I have identified as dark matter waves due to their penetrating and velocity behavior. It began with plant communication experiments in the late 1980's. I wrote an article, which was published in Physics Essays in 1999 explaining the stability and organization of the solar system in terms of standing dark matter waves produced by the solar cycle. I first worked with waves having to do with plants that traveled 25 m/s or less outside and inside of plants in the spring. Later, in the first years, the results were limited or non-existent because I didn't understand the larger wave velocity behavior. In 2011, using proper transmitters and receivers, I have found that the dominant wave velocities can be large and often apparently are a function of the time of year which may have to do with many features of nature. Unfortunately in my later studies I have found that I also receive other signals that give me erroneous results if I don't use proper shielding of receivers and transmitters or do not consider sun activity. The waves appear to have much to do with local nature as well as with universe and solar system organization and stability.
INTRODUCTION In 1988 I chopped into a tree and recorded the resulting signals, which were derived from probes in surrounding trees1. I found that many types of plants appear to be wave controlled2. Lately I found that wood, for example, saturated with salt solution (patent applied for) makes good transmitters and receivers without some of the drawbacks of trees, which cannot be readily shielded3. The produced waves penetrate shields around salt filled samples as if they weren't present while keeping out ordinary electromagnetic radiation. I can pulse the shielded samples electrically to produce a wave signal with the signal strength apparently proportional to the applied voltage. The pulsing current needs to be limited. There are different ways to send signals. One is to use a shielded sample to send a signal to a tree. If the tree and transmitter are close together usually the tree sends a signal back to the transmitter, which in turn sends a signal back to the tree and so on. This continues as the signal strength dies out. The same is true for sample receivers and transmitters. If the signal doesn't die out from a tree the received signal may be an extraneous electromagnetic signal or noise from solar activity. This is occurring as I first write this (about 11:30 AM Jan. 8, 2012 since the location and time is important for my results). I have two trees I am attempting to get to respond to my transmitted signal. One is over my local hill and one is about 57 meters away from the transmitter. Both are responding with the same continuous signal indicating some "strange" very low frequency strong continuous wave signal source somewhere, perhaps nearby or from solar activity. The same was true the following night. I am able get away from electromagnetic signals by using both a shielded artificial transmitter and receiver but not necessarily solar activity noise, which also may be due to penetrating dark matter waves. It is ideal to be able to use tree receivers, if possible, because they appear to be more sensitive as indicated in my 2010 Physics Essays article3. The wave velocities, now obtained, appear often to be a function of the time of year. In the spring, the signal strength is large so the noise isn't as much of a problem. The spring velocities can be very low like 25 m/s or less. The dark matter density might be inversely proportional to the square of the wave velocities of dark matter waves3. In late October, November, January, February, and early March the most dominant measured wave velocities in much of the Northern hemisphere may be greater than 20,000 m/s and perhaps even lower than 25 m/s in April at my location. The later behavior provides low frequencies, as I have measured3, which apparently provide wavelengths appropriate for early plant growth in many plants in the spring of the year (see my early articles). Later, in the summer, when the dominant wave velocities apparently become larger the wavelengths may not be used for plant organization, but may signal plants that it is time to start getting preparing for winter, such as leaves turning color, etc. Note the location on earth might be expected to be important for dark matter density because I am assuming that the earth's tilt and location in orbit as well as location on earth determine the dark matter density. The earth apparently, part of the time, is at least partially on an antinode as implied by data in my 1999 Physics Essays article4. Most other solar system planets appear to be located on or close to nodes, which provides the long sought solar system stability..
METHODS AND MATERIALS Salt filled wood samples as previously described3 were used for both transmitters and receivers. Trees are sometimes used for receivers with low pass filters often used to minimize high frequencies. Also they are often used with salt filled transmitters. When using low pass filters to take out high frequencies the cut off frequencies were often chosen so that they were considerably higher than the frequency of interest, as determined by experiment. Also I often use a notch filter as needed to get rid of 60 Hz. To get away from electromagnetic signals one good approach is to hit the transmitter with an electrical pulse from the location of the receiver. This requires a cord out to the transmitter, one wire of which is usually grounded. A coaxial cable is ideal for this application. A pulse to the transmitter triggers the storage scope, for example, which then records the response to the received transmitted signal. This is generally a decaying sine wave made by the signal bouncing back and forth between receiver and transmitter. This method works very well with shielded transmitters and receivers. The cord length is unimportant except for its resistance, which didn't seem to cause any problems for the current levels involved. I often use a roll of wire for this application, which can be unrolled to fit the measured distance between transmitter and receiver. The latter method could not be used with trees as receivers so the storage scope and transmitter are at the same location with a return cord from the receiving tree. One must monitor for electromagnetic signals to see if tree use as a receiver is possible. My location (42°, 436' North latitude), fortunately, is among mountains far away from electromagnetic sources except for 60 Hz power lines. I am using a type RM 564 Tektronix storage scope for fast signals and a Vernier Lab Quest for slow signals as in Figures 1, 6 and 7. In most cases about 36-v dc was used to hit the transmitting sample for about 0.1 s. For figure 1 I used a low pass filter to attenuate the higher frequencies. Note that for transmitters I applied the electrical signal along the grain of the wood. Received signals came from along grain.
RESULTS For most of my results, for signals traveling back and forth between receiver and transmitter, one would expect the signal to die out if the experiment is valid. I, however, have found trees continuously communicating for some time after being excited by signals from samples. In my through the local hill experiments there apparently is no back and forth oscillation and no continuous oscillation of an extraneous electromagnetic signal for that shown in Figure 1. The transmitting sample, with grounded shield, was in the laboratory about 311 meters from the receiver over the hill. There were two operators, one at each location, for Figure 1, communicating by cell phone, to tell the over the hill operator when to turn on the tree driven receiver at hit time.
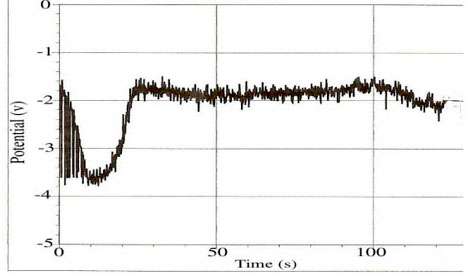
Fig. 1. April 8, 2009 near noon. The location of the maximum negative value provided about 12s. This gives approximately a 25.9 m/s velocity at maximum signal using 311 m as the transmitter and receiver separation. Note that a low pass filter minimized higher frequencies. The transmitter-hit voltage was about 272 v. The hit current was limited by a 25-watt light bulb. There was slight delay in the received signal due to the receiver operator response time to turning on the equipment after receiving the transmitter operator cell phone turn on call. The highest velocity shown is near 3000 m/s due to the about 0.5 second phone delay.
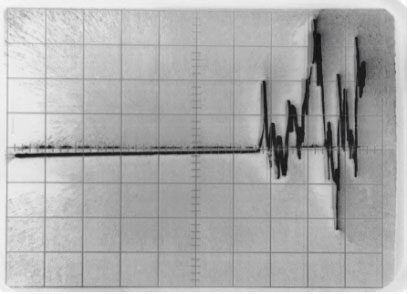
Fig. 2. Jan. 6, 2012. Here I hit the transmitting sample with close to 70 volts.. The vertical scale is 0.05 volts per division and the horizontal scale 0.5 s per division. The transmitter was located straight East 307 m from the tree receiver on the West side of the hill. I neglect the air distance (approx. 61 m) since the air velocity for this frequency was expected to be large.I have used the described hill for an electromagnetic shield over the years. In Figure 2 you see a signal that did not start coming through for more than three seconds. I had installed a wire cord over the hill to bring back the response signal from a tree. 6 insulated wires in the ten-wire cord were used for ground and the other 4 for signal. The cord was much longer than 307 meters. The signal arrived from the transmitter from about 307 m away from the receiver after apparently going through about 246 m of rock and dirt. The cord brought the return signal back nearly instantaneously so the signal traveled about 77 m/s going through the hill (from the delay time on Fig.2) and apparently much faster through about 61 m of air so the thickness of air is neglected. My previous data shows an apparent possible range of velocities for through the hill velocities (see Figure 1 for April data). The relatively long delay in Figure 2 indicates the signal is not electromagnetic but apparently the solid matter has a large effect by lowering the high dominant velocity from what I have found between samples in air for the given time of year. There is some question as to where the signal enters the hill because the hill slopes upward to about 100 m above the transmitter location.
The following are discussion and a few graphs and dates providing some of the velocities for different times of the year. Unfortunately I discovered the higher velocities too late in 2011 to obtain a complete multipoint graph of dominant velocities. In what follows are a few plots of the decaying signals for different arrangements of the transmitters and receivers.
On September 17, 2011, I made two velocity measurements in the lab with a grounded-shield receiving sample the first at 1.17 m from the grounded shield transmitter and the other at 1.88 m from the transmitter. The velocities obtained were 2340 m/s and 2350 m/s respectively.
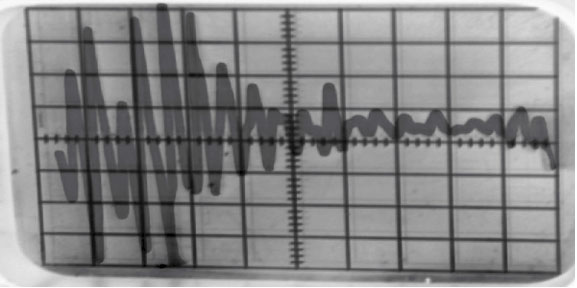
Fig 3. Oct. 8, 2011. The storage scope signal, from a receiving sample, used to determine a particular dark matter wave velocity, for October 8, 2011. This shows the signal "bouncing back and forth between two salt filled samples started by pulsing the transmitting sample with 27 volts which also triggered the scope. The sample separation was about 53 m. The horizontal spacing is 10 milliseconds per division while the vertical is 0.01 volts per division. Taking half the time between a pair of initial upper peaks and dividing into 53 m gives about 19, 696 m/s. The signal from the receiving sample was amplified about 5000 times since the high frequency signals are often so weak in comparison to the spring signals described in references 1 and 3 where I used a strip chart recorder without other amplificationA prominent velocity of dark matter waves in air at my location, was apparently about 2000 m/s in late August and with the proper low pass filter were found above 20,000 m/s in October, November, December and on about January 20, 2012 it was apparently above 25,000 m/s. See Figures 4 and 5 for other examples of measurements made.
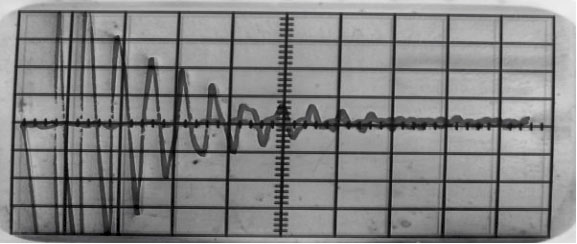
Fig. 4. Jan. 18, 2012. Signal sent about 13.42 m East and West. Horizontal scale 2 ms per div, Vertical scale. 0.01 v per div. About 1.16 ms between peeks. Velocity calculates to be about 23,140 m/s.
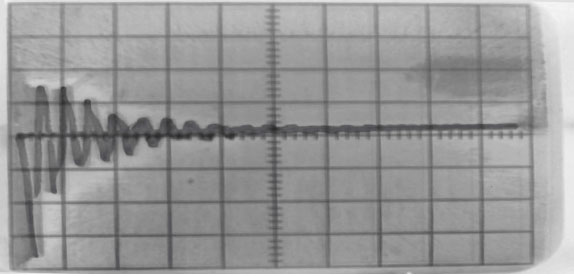
Fig. 5. Jan. 21, 2012. Signal sent vertically, 3.2 m. About 0.25 ms between peaks. Velocity calculates to be about 25,600 m/s. There is always some error in the calculations due to the nature of the oscilloscope graphs.The experimental results here seem a bit different then expected. From the experiments it appears that the waves travel at near the same velocity both vertically and horizontally (within the possible error in scope reading, dates, and distance readings) in air. See Figures 4 and 5. I was expecting that the vertical velocities would be found to be larger than horizontal velocities. Within trees it appears that vertical velocities are larger than horizontal velocities2 but internal velocities are much lower than external velocities and depend on the species2. I found in my experiments that the external vertical velocities appear to be the nearly the same, within the experimental error, as horizontal. Apparently there are other factors determining the in tree velocities likely having to do with the plant's composition, gravity, and perhaps dark energy. I suggest that the latter may be more important in vertical plant growth than gravity. When I made the latest shown external observations the prominent velocities were apparently very large compared to spring velocities and plants apparently are not much involved. The largest amplitude velocity was apparently about 25 m/s on March 31, 1988 and in early May 2008. See reference 3.
In the fall of 2010, I spent much time over several months monitoring interesting signals coming in on a grounded shielded detector. I assumed their travel speed was around 25 m/s because of their long periods. I was excited that the signals often looked like they might be produced by intelligence. If one analyzes the data in detail, in time, most looked like some kind of code. Likely, however, they are naturally produced. See Figures 6 and 7, for example:
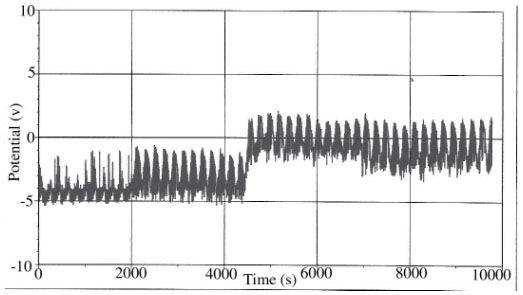
Fig. 6. Nov. 18, 2010. Signal from a shielded sample. The peaks are generally composed of a series of smaller peaks often at full amplitude and about half amplitude. The gain on the amplifier was 1000. Different type signals came in on different days
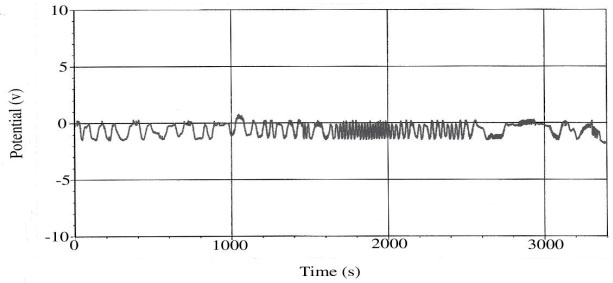
Fig. 7. Nov. 29, 2010. Notice the different structure from Figure 6. The receiving sample was kept at room temperature since the receiver setup was in my residence office.
NATURE OF DARK MATTER WAVES I have been changing my ideas of dark matter waves often during the past year or so due to my experiments. I early assumed that the most common velocity in air is 25 m/s or less finding that this apparently is not the usual the case. I have assumed vertical velocities greater than horizontal velocities in air, which does not seem to be the case. I now hypothesize that dark matter wave velocities might be larger than the velocity of light for very thin dark matter5. Do dark matter waves exert pressure on matter? Is it possible that wave pressure causes the major acceleration of the universe and is at least partly responsible for dark energy especially if we assume dark matter waves are not limited in velocity? Most of the matter in the universe seems to be producing dark matter waves which are traveling outward penetrating all matter, but may be pushing outward on matter as they penetrate. All the suns, and perhaps other entities, in the universe are putting out dark matter waves, perhaps forcing matter out like a continuous explosion. This could produce the observed acceleration attributed to dark energy. The previous discussion of dark matter waves slowing down going through matter might provide some explanation for this (see Fig, 2). An interesting comparison is that my detectors are concentrated ions in porous materials and this might be compared to the sun, which appears to be a source of dark matter standing waves (1999 Physics Essays article). It all seems to point to a reasonable picture explaining the operation of my artificial receivers and transmitters.
CONCLUSIONS AND OBSERVATIONS The possible variation of dominant velocity with dark matter density on earth suggests a possible method of determining dark matter density throughout the universe. Possibly the prominent velocity can be near infinity in very thin dark matter, which may permit communication across wide regions of nearly empty space with the proper transmitters and receivers. Apparently dark matter and waves organize the galaxies and the universe. The speed of light may not be a limiting factor. We may find sources of dark matter waves from sun systems, which we wish to study! The idea that dark matter waves support dark energy may be speculative but it seems reasonable. Some of the most recent data (Feb. and Mar. 2012) suggests that very thin dark matter is coming in bursts with wave velocities of the order of 105 m/s! This seems to be correlated with solar storms. This is an active time in the solar cycle. Note that from Figure 1 it appears there may be a range of velocities for every test with a velocity for the maximum amplitude. I have been attempting to use the maximum amplitude velocity for my general measurements.
REFERENCES (1) O.E. Wagner, W-Waves and Plant Communication Northwest Science 63, 119 (1988)
(2) O.E. Wagner, A Basis for a Unified Theory for Plant Growth and Development, Physiol. Chem. Phys. and Med. NMR 31,109(1999).
(3) O.E. Wagner, 1/f Noise and Dark Matter Waves in Trees, Samples, and Air, Physics Essays 23,44 (2010).
(4) O. E. Wagner, Waves in Dark Matter, Physics Essays 12(1), 3(1999).
(5) O. E. Wagner, All Pervading Waves Suggest Universal Control and Communication, Frontier Perspectives 6(1): 41-47 (1996).
| Copyright ©1996-2018 Orvin E. Wagner |
 Waves in Dark Matter