|
|
1/f Noise and Dark Matter Waves in Trees, Samples, and Air
Orvin E. Wagner
Wagner Research Laboratory
Grants Pass, OR 97527
Email: oedphd@gmail.com
ABSTRACT. I found that much of 1/f noise is apparently caused by dark matter particles. In experiments with noise receivers in
grounded and ungrounded aluminum boxes, the low frequency noise produced was found to be a function of the sample
orientation as well as outside phenomena. These results indicate that the low frequency noise is arising from outside sources
and is not innate to the source as is generally assumed. As with dark matter, signals penetrate grounded or ungrounded metal
boxes. Electrically pulsing a sample within an aluminum box produced short bursts of oscillations in surrounding trees and in
another aluminum shielded sample. The observed phenomena were also used for communication between special samples.
Trees were found to oscillate at different frequencies for long times. These oscillations were often at large amplitudes and often
apparently initiated by a shielded pulsed sample. Signal velocities were found to be 25±1 m/s in air. The lack of affects due to
metal shielding, the wave penetration of plant tissue reported in my earlier work, and low velocities, are consistent with dark
matter involvement and provide useful penetrating communication for human purposes.
Key words: dark matter waves, matter penetration, signal velocities, dark matter, signal transmission and reception, waves in
plants
INTRODUCTION
Dark matter does not interact electromagnetically so it penetrates all matter. Its density and my hypothesized sound like waves
(or some other undiscovered property) permits it to displace charge. This is apparently observed with 1/f noise in my work with
plants and special samples. I am proposing that much of 1/f noise1 is caused by dark matter particles colliding with matter and
scattering charge to produce what has been designated 1/f noise. Some have considered that since dark matter doesn't interact
it could not cause the noise. I suggest that some property requires it. For example, perhaps the numerical density is large and
collisions with charge can't be avoided.
For more than 20 years I have been studying plant wave characteristics (work before and published work in reference (2) and
onward). For example I first observed, with high impedance voltmeters, that charge piles appear at intervals along the trunks of
trees. The charge piles are apparently produced by sound like standing waves. These charge piles seem to telescope into short
sections cut from the same trees (and other plants). The charge pile spacings appear to be related to plant internodal spacings
such as spacings between leaves and branches. The charge piles usually are not at regular intervals because of a set of many
frequencies. The standing waves have many different wavelengths3.
The data suggest that the waves in and outside of plants are produced by slow moving sound like waves traveling in relatively
dense dark matter4,5 in plant material . In my early work with what I designated plant communication the waves involved were
produced by my mechanically disturbing the standing waves in certain plants while other plants received the resulting
signals6.
In the present paper I report that oscillating waves may be bouncing continually back and forth between plants and that we can
communicate using the waves with special transmitters and receivers. Properly disturbing one plant disturbs the surrounding plants.
I suggest that anything disturbing the standing waves in one plant or special samples disturb the standing waves in surrounding
plants and special samples due to waves traveling in dark matter in air and various materials.
In my experiments the signals seem to travel through other plants and metals like they were transparent except for the observed
interactions. Plants grow where growing conditions are proper such as deep underground where the waves would also be
required to produce plant form. The required penetrating qualities here again suggest dark matter is involved. In a paper that
was published in 1999, I propose that the solar system is organized by dark matter standing waves from the sun and that the
solar cycle is just due to dark matter oscillating within the sun5. The literature is replete with discussions and proofs of Dark
Matter4.
METHODS AND MATERIALS
The basic sample that I used for my in house transmitter, receiver, and noise source was first a live wood xylem sample that was
prepared in concentrated, near 70o C, NaCl solution for about five days. This sample then slowly dried while in use. The usual
sample dimensions for the experiments here were about 47 cm long and about 4 cm2 on the ends. I had earlier found that
standing waves, indicated by charge piles, were present in such samples6. I used small steel probes for the study. Freshly
prepared wood samples seem to be unique compared to samples of ordinary porous materials. A problem with this type of
sample is drying and salt ejection. For purposes here the samples may work optimally after a week or so of drying (depending
on the drying conditions) and then the effectiveness gradually degrades. This requires much new preparation. I used this type of
sample in the 60's to find molecular parameters (and a capacitor and thermistor patent 3493913, 1970) for salts. The samples
used here have unique characteristics over ordinary porous materials. For example, the end that was the lower end in the tree,
heats first when ac current is passed through the sample. To send signals, I pulsed these samples electrically either manually
initially with a 9-volt battery or with a 555 timer driving a power transistor emitter follower (biased so there is no current when the
pulse is off) with the sample the emitter load resistor.
With my present equipment, I can set the pulse rate as slow as one every 2 min 40 seconds with a changeable pulse length
of 0.2 to 1.0 second. Two very closely spaced probes were added on the transmitting sample to use to make the pulse show
with the return signal as shown in Figures 3 and 4. Only the end probes were pulsed. I monitored noise from samples mounted
and centered in 2 aluminum, closed, grounded and ungrounded boxes with the samples mounted (and centered) along the
shortest dimensions. Each sample was mounted in 5 cm diameter ventilated (holes drilled at regular intervals along it for
ventilation) PVC pipe with smaller diameter PVC spacers so that I could change the box and sample spatial orientation without
disturbing the sample mounting in the box. The two aluminum boxes outside dimensions were about 82.5x58x59 cm3 and
55x28.6x32.4 cm3 respectively, with the lids clamped on. The larger box held the transmitting sample. I placed small diameter
steel probes in trees (and treated debarked samples) with penetration into xylem tissue of about 0.5 cm after removing the bark
from an area just large enough to accommodate the probe. I used small diameter coaxial line to carry signals where needed.
Other equipment included a storage scope (Tektronix RM 564 with 3A72 and 2B67 plug ins and a strip chart recorder as well
as in house built adjustable gain instrumentation amplifiers using AD620's. These were shielded and battery operated. I also often
used passive low pass filters to get rid of ac line interference.
Signals from trees were picked up using steel probes (first one of two at about 20 cm above ground) a few millimeters in diameter,
which were pushed into a small area of debarked xylem tissue about 0.5 cm. The probes in the Douglas fir tree used in this article
were about 7 m. from the transmitting sample and were placed at 4 m. apart. On the tree farthest away (at about 43.6m) for this
article the probes were placed about 5 m. apart. The two samples, in their respective aluminum boxes in the lab, were
about 1.7 m. apart and farther apart for successful later experiments.
Past measurements seemed to indicate that the amplitude of signals from receiving trees, in the early plant communication
experiments, were proportional to the square root of the separation of the probes along the tree trunk7. This would indicate that
the longer the receiving or transmitting sample the larger the signal strength. This suggests that my relatively short samples would
not be as sensitive as receivers as probes spaced far apart on trees. I used a sensitive strip chart recorder, without other
amplifiers or filters for measurements of the tree signals reproduced in this article. The figures show larger squares that were
exactly 1 cm2 on the strip chart recorder and oscilloscope but dimensions were changed when transferred to this article.
NOISE RESULTS
It appears that much of the observed low frequency measured noise, at this location is 1/f noise related. Often it was observed
that the noise was greater for a sample with vertical orientation (rather than horizontal) within an aluminum box. For an example
see Figure 1.
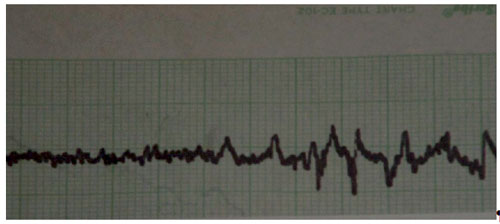
The noise from the samples tested often varied with time of day as well as from orientation. Wind blowing outside moving tree branches (the tests were done in a wooded area) seemed to affect the noise output from the shielded samples (the noise changed characteristics with a periods often proportional to the period of moving branches). Noise characteristic changes of any kind tend to show that noise is coming from outside sources. These results again all indicate that the noise-producing source is outside the aluminum box or sample and are not innate to the producing sample as has been explained for 1/f noise thus far.
The idea of waves in plants also suggests matter-penetrating waves. The shield penetrating qualities of the signals indicate that they do not interact electromagnetically but they do organize and displace charge as seen in my plant experiments (ref. 2 (1988) and onward). The results here apparently indicate dark matter particles interacting with charge and also much of my earlier plant work (ref. 2 and onward.) indicates sound like waves in dark matter.
The indications here are that much of the observed 1/f noise is due to dark matter particles colliding with charge. This is concluded from the velocities and penetrating qualities observed. The dark matter density apparently is large enough to produce the observed results. A recent article8 suggests that the order of magnitude dark matter density on the earth is 105 Gev/cm3 . Or this means it might be as high as 106 Gev/cm3 and not the usual estimated density of 0.3 Gev/cm3. The Pioneer anomaly may suggest an even higher density. The authors of the given reference suggest that a dark matter halo might be the reason that the solar system exists in agreement with my 1999 Physics Essays paper5.
OTHER RESULTS
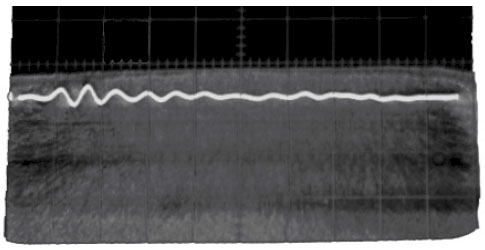
I hypothesize that if I disturb the standing waves pattern (indicated by changing charge concentrations) in samples, either mechanically or electrically, that a transmitted signal is received by surrounding trees and nearby samples. It was observed that trees seem to be easily excited into sometimes rather large oscillations by signals from shielded electrically pulsed samples (or damaged surrounding trees6). In this article I report signals in surrounding trees and samples due to electrically pulsing a shielded sample. I first used a 9-volt battery and manually pulsed a sample with surprising results in another nearby shielded sample and trees. I took measurements from a Douglas fir at about 7 m. away from my transmitting sample. It was about 0.5 m. in diameter at the base and 27m. tall. I also used a Ponderosa pine 29 m. tall and about 0.6 m in diameter at the base at about 43.6 m. away. Several comparable sized trees were between the pine and the transmitting sample. If one pulses a shielded sample a typical signal from a probed tree or second sample, there is often a brief oscillation that dies out after a few cycles. See Figures 2, 3, and 4.
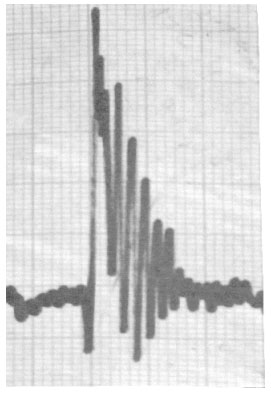 |
Figure 3. This picture is from a strip chart recording. The receiving tree was about 7 m away from the transmitting sample.
The initial peak is a fraction of the pulse height. The following peaks were measured to be 0.225 cm apart with the strip chart
recorder running at 25 cm/min so half the time between peaks is 0.27 sec.
The velocity between the tree and the transmitting
sample is thus 25.9 m/s considering signal exchange. The vertical scale is approximately 0.25 mv/cm using only the strip chart
recorder for amplification.
(A Douglas Fir tree at 7 meters from transmitting sample May 5, 08).
|
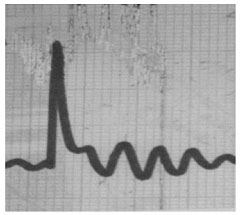 |
Figure 4. This again is from a strip chart recording. The peaks following the pulse were measured to be about 0.6 cm apart
with the strip chart recorder running at 10 cm/min. One half the time between peaks is about 1.8 seconds. 43.6 m/1.8s is 24.2
m/s for the velocity between pulsed sample and pine tree. (Pine tree at 43.6 meters from transmitting sample.)The average of the
three velocities is 25.3 m/s. I suggest a possible error of 1.0 m/s or 25 plus or minus 1 m/s for the velocity between samples and trees
considering that the trees and samples are exchanging signals. May 7, 08, about 13oC.
|
The given curves are typical from a whole set. Later in the spring and with higher temperatures often the pulsing results are not so well behaved. It appears that a tree may oscillate over a whole day or so at often, different frequencies. These signals suggest exchanges of signals with unmonitored trees in the area. Oscillation appears to take on two forms: oscillation of resistance and voltage oscillation. In resistance oscillation just putting an ohmmeter across two widely spaced probes may show a change in resistance of 50% or so in the range of megohms with a period of one half second or so. In these cases, often a voltage change doesn't show using a high impedance voltmeter. Oscillating voltage amplitudes produced elsewhere by pulsing the enclosed sample in the lab, in the larger aluminum box, may provide variations of several millivolts.
The three given cases of short oscillations seem to reveal important characteristics. The return frequency from the 2 tree receivers was inversely proportional to the distance between the transmitter and receiver. I used one half period from each oscillation for velocity calculations (since I assumed an exchange oscillation between tree transmitter). The distance between transmitter and receiver was 1.7 m. for the two samples, 7m and 43.6 m from the transmitter for the two trees. I obtain 25±.1m/s as the velocity between transmitting sample and the receivers. Often the return frequency, later in the spring, seemed to be a random low frequency (often repeating). Perhaps these more or less random very low frequencies represent exchanges of signals between the observed receiver and a nearby tree since the experiments were done in a treed area. One might expect a delay in a trees response because of the length of the portion of tree involved in processing of the signal. I would not expect such a delay for the short salt filled samples.
One can use 25 m/s to calculate a dark matter density on earth by using the idea that velocity of dark matter waves is inversely
proportional to the square root of the density of dark matter. I assume the dark matter density drops off as 1/r2 as one leaves the
sun5 and use the density of dark matter at 1010 km from the sun as 0.3 Gev/cm3
then the density at the sun's surface
is 9.97x 10⁻³ joules /cm3 or 6.23 x 10⁷ Gev/cm3
and the velocity of dark matter waves going away from the sun's
surface is 1.25 m/s. Then 25/1.25 = √(6.23x10⁷/de) or
de=6.23x10⁷/400 or 1.56x 10⁵
Gev/cm3 which compares favorably
with the Frere estimate8. A formula for the density of dark matter (d) in terms of the velocity of dark matter waves
would be:
d=9.75 x 10⁷/v2 Gev/cm3, where v is the velocity in m/s.
CONCLUSIONS AND OBSERVATIONS
I have just proposed that much of 1/f noise is caused by charge being displaced by relatively dense dark matter particles. The work here suggests that the dark matter waves interact with charge. The data might suggest that the dark matter particles are comparable in size to ordinary charged particles. Plants apparently often interact continuously, with dark matter signals passing between them. It appears that I have been able to cause plant responses just by electrically pulsing shielded salt solution filled wood samples within shields. Two of these are the low velocities and penetrating qualities that one would expect from waves in dark matter. Note that later in the summer (June, July and August this year) more noise and apparent random oscillations often seem to be present, often preventing taking of meaningful data.
Dozens of measurements suggest that signals sent to a receiving sample are not always returned to the transmitter and the receiving sample will just oscillate at some frequency and the signal will then die out, especially if the receiving sample is far away from the transmitter. In my earlier work with plants wave velocities in plants are dependent on the direction of gravity in the plant part. This suggests that dark matter interacts with gravity in special ways, at least in plant media, with the interaction anisotropic3 . One area I have neglected so far is temperature dependence. Likely some of the later oscillations arose due to temperature increases. The data in this article was taken at close to the same temperature. The relatively high density of dark matter on earth may have large, often subtle influences on the life of humans, other animals, plants, and other phenomena. The latter requires much study. I have a patent pending on the transmission and reception phenomena reported in this article.
REFERENCES
(1) Lawrence M. Ward and Priscilla E. Greenwood , Scholarpedia 2(12), 1537 (2007).
(2) O.E. Wagner , Northw. Science 62(5), 263-270 (1988).
(3) O.E. Wagner, Physics Essays (in press) 2008.
(4) Douglas Clowie, Marusa Bradoc, Anthony H. Gonzales, Maxim Christine Jones and Dennis Zaritsky, The Astrophysical Journal Letters 648, L109-L113(2006).
(5)O.E. Wagner, Physics Essays 12(1), 3-10 (1999)
(6) O.E.. Wagner, Northw. Science 63(3), 119-128 (1989)
(7) O.E. Wagner, Frontier Perspectives 10(2), 23-34 (2001).
(8) J.M. Frere,. F.S.Ling, and G. Vetrtongen, G., Phys Rev. D77(8), 083005 (2008).
| Copyright ©1996-2018 Orvin E. Wagner |
 Waves in Dark Matter